
On a national scale, agricultural and resource land has the potential to continue its appreciation in the long term. Notable drivers of long-term demand growth include population growth and urbanization, along with food production, renewable energy demand, natural resource demand and recreational land use.
An important distinction to draw between agricultural and resource land is how the land is used and the regulatory environment surrounding its use. Agricultural land is typically used on a continuous basis and subjected to regulations surrounding the use of pesticides, fertilizers and other chemicals. However, resource land is often used for a specific amount of time and has strict regulations surrounding resource extraction, processing and the associated environmental externalities. Land-use policies and regulations, conservation programs, subsidies and tariffs can have a significant impact on land values.
Several trends are currently present in the agricultural and resource land market, including:
Agricultural Land
- Farmland consolidation, as larger, more efficient operations benefit from economies of scale.
- Generational shifts, as farmland ownership transfers hands from owners whose average age is 57, according to the Department of Agriculture (USDA).
- Increased interest in alternative forms of agriculture, such as urban and vertical farming.
- Technological advancement, including precision farming and further automation.
- Increased demand in farming regions, with higher water security and the adoption of new farming practices and technologies to adapt to climate change.
- Environmentally friendly production methods, increased demand for organic and sustainably produced food, and regulatory changes that impact yield and costs.
Resource Land
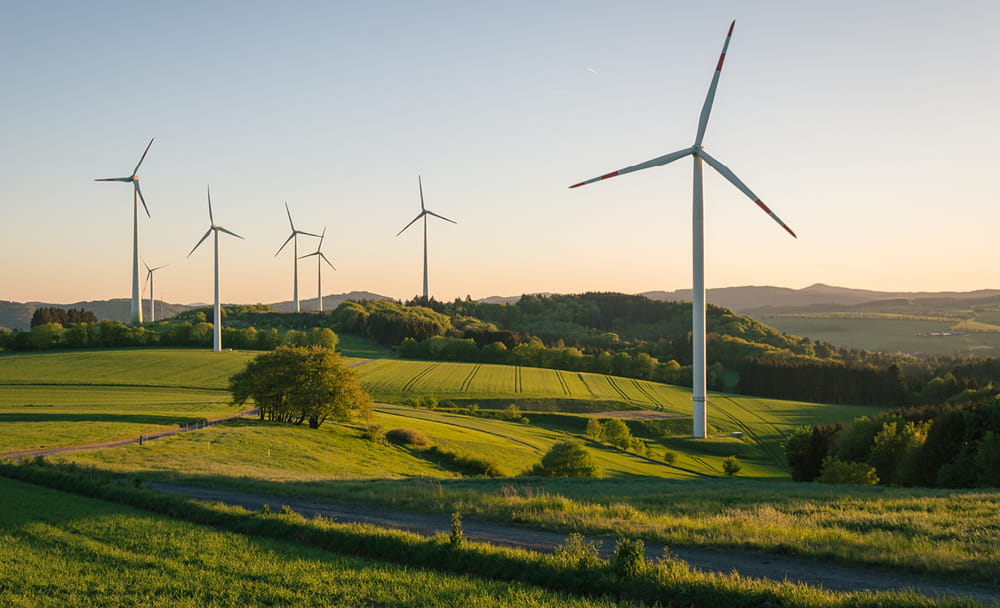
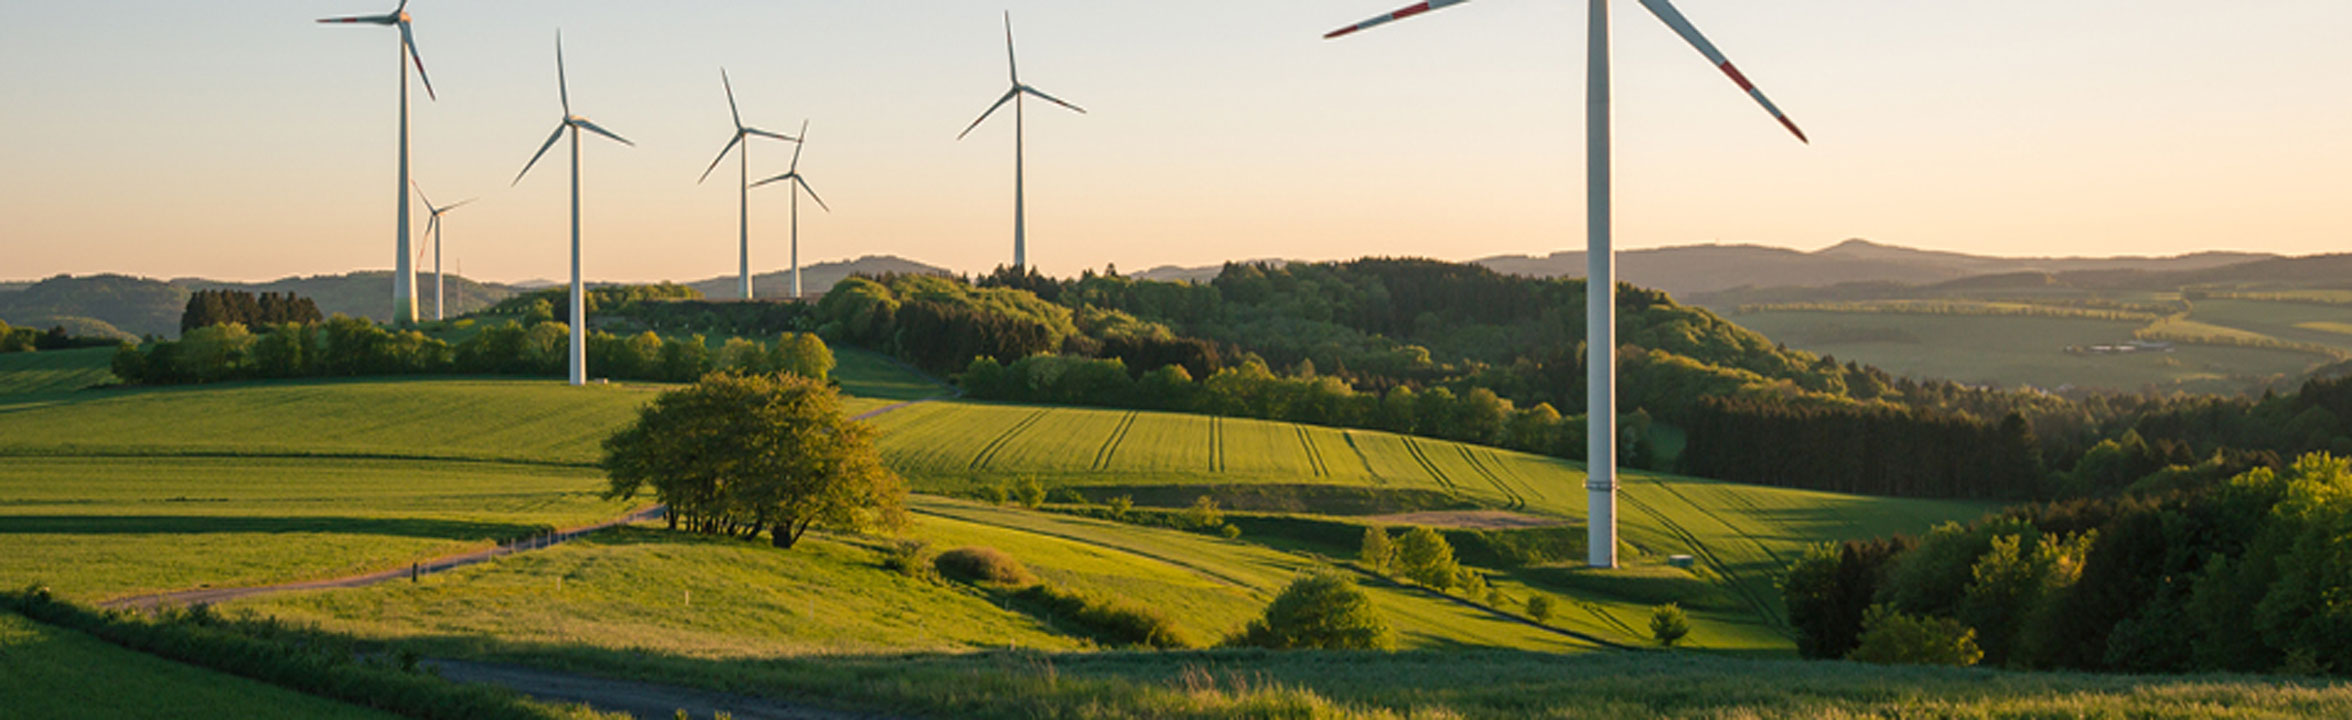
- Increased demand for renewable energies, such as wind and solar.
- Regulatory impacts related to resource extraction and processing, along with government support toward open-space preservation over continued or new-resource development.
- Increased focus on environmental sustainability, greenhouse gas reduction and conservation.
- Technological advancement in resource extraction and processing.
- Political and economic uncertainty, which can affect resource demand and land values.
Like other real estate asset classes throughout the pandemic, agricultural and resource land has seen an above-average increase in dollars-per-acre value. Total farm, cropland and pastureland values have followed a similar trend from 2008-2022, where values saw a slight decrease year-over-year (YoY) following the Great Recession. From 2009-2012, agriculture and resource land recovered and continued an upward trajectory to 2022, according to the USDA.
In 2008, the average total farm value in the United States was $2,170 per acre. By 2022, this value had increased by 75% to reach $3,800 per acre. This can be primarily attributed to the growth in cropland values, which saw an 83% increase—from $2,760 per acre in 2008 to $5,050 per acre in 2022. Pastureland, on the other hand, saw slower growth, with values increasing by 51% over the same period— from $1,090 per acre in 2008 to $1,650 per acre in 2022.
The most significant gains in value, according to the USDA, occurred from 2021-2022, where YoY increases reached 11.5% for pastureland, 12.4% in the total farm value and 14.3% in cropland. Unlike what was observed after the Great Recession, which saw YoY values decrease in 2009 following the economic upset, values instead stagnated in 2020 with neither a loss nor gain that year before experiencing above-average growth in 2021 and record growth in 2022. Cropland has seen both the biggest contraction and the biggest increase in YoY values from 2008-2022, with cropland values decreasing 4.3% YoY in 2009 and rising 14.3% in 2022. Other notable increases in cropland occurred as values recovered in 2011 (+10.4% YoY), 2012 (+12.4%) and 2013 (+13.7%). Pastureland has also seen variance over the same time, with a 2.8% decrease in 2009, 10.3% increase in 2014 and 11.5% increase in 2022. Aside from recession value compression in 2008 and pandemic gains starting in 2020, increases in 2011-2014 were likely driven by two factors: the agricultural commodity price boom that started in the summer of 2010, which saw 60% increases in food commodity prices YoY; and low farm mortgage fixed interest rates at 5.9% in fourth quarter 2011, as reported by the Minneapolis Federal Reserve – Agricultural Credit Conditions Survey.
The upward trend in land values is prevalent in states such as California, Colorado, Florida and Texas, with wider variations surfacing between land-use type and geographic locality. For example, California and Texas both saw growth in total farm value following the Great Recession, whereas Colorado and Florida both saw values decrease during the same time.
CALIFORNIA | COLORADO | FLORIDA | TEXAS
CALIFORNIA
California is known for its diverse and abundant agricultural industry, which produced 12% of all U.S. agricultural commodities in 2021, according to the USDA. The state's ideal climate, fertile soil and access to water resources make it an ideal location for farming and agriculture. As a result, the agricultural land market in California is a significant contributor to the state's economy. However, the ongoing drought and changing regulatory environment has affected the availability of water when crops need it most. Moreover, the 2020-2022 drought saw irrigated crops decrease by 563,000 acres in 2021 and 752,000 acres in 2022—or 7.4% and nearly 10% of total irrigated cropland studied for the California Department of Food and Agriculture. Impacts of the Sustainable Groundwater Management Act (SGMA) and conversion of agricultural land for master planned communities and utility-scale solar projects have also placed downward pressure on irrigated cropland acreage.
The agricultural land market in California has been robust and has seen a significant increase in value over the past 15 years, with total farm value increasing by 86%—from $6,440 per acre in 2008 to $12,000 per acre in 2022. This represents a near doubling of value over 14 years.
Cropland in California, which is more valuable than pastureland, has also seen a significant increase in value, rising by 56%—from $9,880 per acre in 2008 to $15,410 per acre in 2022. Within the cropland market, non-irrigated cropland has seen the most significant gains, with values increasing by 85%—from $3,570 per acre in 2008 to $6,600 per acre in 2022. Irrigated cropland has also seen an increase in value, but at a slower rate of 47%—from $12,300 per acre in 2008 to $18,100 per acre in 2022. In contrast, pastureland in California has seen much slower growth than cropland, rising by 17.5%—from $3,020 per acre in 2008 to $3,550 per acre in 2022.
COLORADO
Like national trends, the agricultural land market in Colorado has seen significant growth over the past 15 years. Population growth, urbanization, rising commodity prices and large investments in irrigation and infrastructure in Colorado have driven demand and increased values for agricultural land. Farm cash receipts in the state totaled $8.2 billion in 2021, according to the USDA, with livestock production accounting for 69% of the total, and crops comprising the remaining 31%.
Since 2008, total farm value has increased 54%, from $1,150 per acre to $1,770 per acre in 2022. This past year also marked the highest YoY growth rate in the state, as values climbed 9.9% from 2021 to 2022. However, the growth in the value of cropland has been particularly striking, with values up 89%—from $1,310 per acre in 2008 to $2,480 per acre in 2022. Irrigated cropland has also seen a significant increase in value, growing 86% over the same period—from $3,100 per acre in 2008 to $5,750 per acre in 2022. Non-irrigated cropland values grew 80%, from $890 per acre in 2008 to $1,600 per acre in 2022. Pastureland has seen slower growth compared to cropland, with values increasing 32%— from $710 per acre in 2008 to $940 per acre in 2022.
FLORIDA
TEXAS
Much like the national market, the agricultural land market in Texas is large and diverse, and its size and varied climate contributes to its diversity. For example, the High Plains region in Northwest Texas is known for its dryland farming, where annual potential water evaporation exceeds annual precipitation. Also, the Blackland Prairie region in Central Texas is known for its rich soil and intensive crop production.
As we’ve seen nationally, the agricultural land market in Texas has experienced a high degree of growth over the past 15 years, with total farm value increasing by 71%—from $1,550 per acre in 2008 to $2,650 per acre in 2022. The value of cropland has also seen significant growth, with a 61% increase from $1,500/acre in 2008 to $2,420/acre in 2022. Both irrigated and non-irrigated cropland saw high gains, with irrigated cropland experiencing a 70% increase in value over the period and non-irrigated cropland increasing 59% in value. Pastureland values have also increased, but at a slightly slower rate than cropland, with values increasing 46% over the period—from $1,400 per acre in 2008 to $2,050 per acre in 2022.