CONTACT US
Share: Share on Facebook Share on Twitter Share on LinkedIn I recommend visiting cushmanwakefield.com to read:%0A%0A {0} %0A%0A {1}
Midwest Industrial Spec Report-Hero Large Midwest Industrial Spec Report-hero mobile

The U.S. industrial construction sector has seen a slowdown after delivering 1.1 bsf of new space in 2022-23, with speculative development previously driving construction due to pandemic-induced demand. The Midwest experienced a surge in speculative deliveries, totaling 166 msf across major markets and 334 msf since 2018, with over 70% occupancy by Q1 2024. However, economic challenges have dampened demand, leading to increased vacancy rates and a 40% reduction in the construction pipeline YOY, signaling a continued decline in 2024. Speculative construction starts in the Midwest have also fallen from an annual average of 140 to just 92 by Q1 2024. The data tells us that while the industrial boom is slowing, the Midwest remains resilient.

The Midwest Speculative Construction Report analyzes speculative with buildings that are 100,000 sf and greater, a clear height of 28’ and greater and built since 2018, in Chicago, Indianapolis, Cincinnati, Columbus, Kansas City, St. Louis, Minneapolis, Detroit and Louisville. Specifically, each market takes a deep dive into:

  • Speculative bulk occupancy
  • Number of buildings completed
  • Square feet delivered
  • Average building size
  • Number of developers involved
  • Number of current tenants
 
Want more information?
Stay up to date about what's next for the Logistics & Industrial sector of commercial real estate.
SUBSCRIBE Learn more about Industrial

Related Insights

2023pds-industrial-costs-card
Research • Construction

Industrial Construction Cost Guide

An essential tool to guide capital expense decisions for industrial real estate.
Brian Ungles • 5/29/2024
Ports
Article

U.S. Ports Update

Overview of U.S. port-proximate industrial real estate markets and port performance.
Jason Price • 5/29/2024
2019 US Industrial Construction Map
Research • Construction

Industrial Construction Map

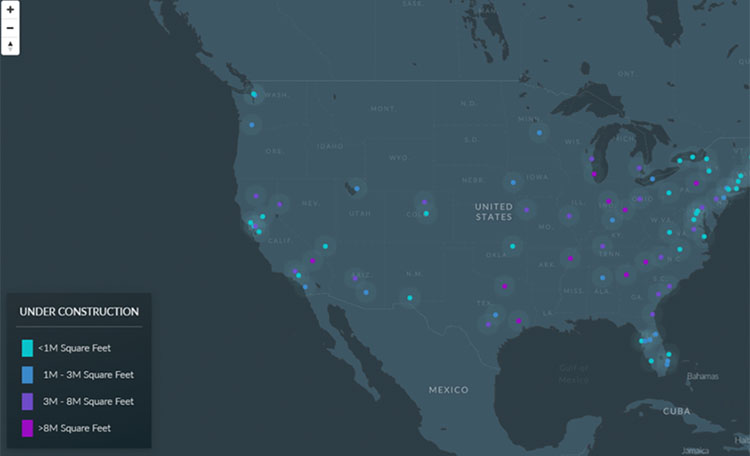
Use Cushman & Wakefield's interactive map to find out how much industrial commercial real estate construction activity is taking place in select North American cities.
1/11/2024

Ready to talk?

Our professionals are ready to provide further details on this and many other topics.

With your permission we and our partners would like to use cookies in order to access and record information and process personal data, such as unique identifiers and standard information sent by a device to ensure our website performs as expected, to develop and improve our products, and for advertising and insight purposes.

Alternatively click on More Options and select your preferences before providing or refusing consent. Some processing of your personal data may not require your consent, but you have a right to object to such processing.

You can change your preferences at any time by returning to this site or clicking on  Cookies

More Options
Agree and Close
These cookies ensure that our website performs as expected,for example website traffic load is balanced across our servers to prevent our website from crashing during particularly high usage.
These cookies allow our website to remember choices you make (such as your user name, language or the region you are in) and provide enhanced features. These cookies do not gather any information about you that could be used for advertising or remember where you have been on the internet.
These cookies allow us to work with our marketing partners to understand which ads or links you have clicked on before arriving on our website or to help us make our advertising more relevant to you.
Agree All
Reject All
SAVE SETTINGS