Insights
Featured

Insights • Food & Beverage
Recently, Spain has witnessed a surge in high-end food halls, with various examples in big cities such as Madrid or Barcelona.

Research • Investment / Capital Markets
Southern Europe Investment Market Overview
Get a summary of the investment market in the Southern Regional Markets - Italy, Spain and Portugal - giving an overview of the historic investment trends and volumes, for each country.


Investor
Research • Investment / Capital Markets
Southern Europe Investment Market Overview
Get a summary of the investment market in the Southern Regional Markets - Italy, Spain and Portugal - giving an overview of the historic investment trends and volumes, for each country.

Research • Investment / Capital Markets
Research • Investment / Capital Markets
Reno Cardiff • 10/04/2023

Insights • Investment / Capital Markets
Reno Cardiff • 07/03/2022

Insights • Investment / Capital Markets
Reno Cardiff • 15/06/2021

Office
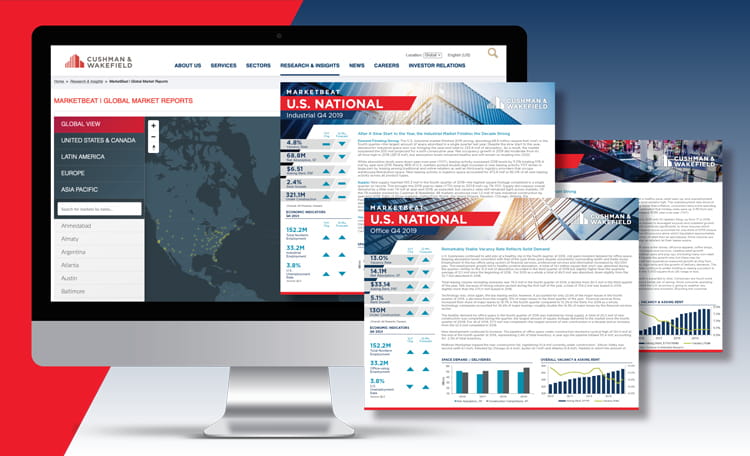
MarketBeat

Research • Workplace
Spain Office Fit Out Cost Guide


Retail
Research
Research • Investment / Capital Markets


Logistics
MarketBeat

Insights
Complete Asset Optimisation Guide


Hospitality
MarketBeat